5:06 PM Tuesday, January 31, 2023
| Normals and Extremes for February at Duluth, Minnesota Normal high on the 1st: 21 degrees Normal high on the 28th: 30 degrees Normal low on the 1st: 2 degrees Normal low on the 28th: 11 degrees Average monthly temperature: 15.4 degrees Highest: 31.3 degrees set in February 1877 Lowest: -2.2 degrees set in February 1936 Normal precipitation: 1.01″ Wettest: 4.24″ set in February 1922 Driest: 0.10″ set in February 1896 Normal snowfall: 15.1″ Snowiest: 36.4″ set in February 2019 Least snowy: 1.0″ set in February 1896 Average number of subzero nights in February: 10 Most: 24 set in February 1875 Fewest: 0 set in February 1998, 1882, 1878 and 1877 Average number of days with at least 0.1″ snowfall: 11 Average number of days with at least 1.0″ of snowfall: 5 Note — Average date for the first 40-degree temperature in Duluth is February 11th (1875-2022 climate period) Astronomical Data for February Sunrise on the 1st: 7:33 AM CST Sunrise on the 28th: 6:50 AM CST Sunset on the 1st: 5:12 PM CST Sunset on the 28th: 5:52 PM CST |
February Snowfall Totals at Duluth, Minnesota (2012-2022)
Normal snowfall in February is 15.1″
2012: 19.7″
2013: 19.1″
2014: 29.5″
2015: 8.2″
2016: 12.2″
2017: 14.1″
2018: 24.2″
2019: 36.4″
2020: 5.4″
2021: 8.6″
2022: 24.2″
Since 2012 — 6 Februarys have had above average snowfall in Duluth while 5 had below average snowfall.
Note
-February 2019 was the snowiest February on record
-February 2014 was the 6th snowiest February on record
-February 2018 was the 9th snowiest February on record
Temperature Anomalies for February at Duluth, Minnesota (2012-2022)
Average monthly temperature in February is 15.4 degrees.
Average monthly temperature in parentheses
2012: +8.3 degrees above average (23.7 F)
2013: -0.8 degrees below average (14.6 F)
2014: -10.1 degrees below average (5.3 F)
2015: -10.2 degrees below average (5.2 F)
2016: +1.9 degrees above average (17.3 F)
2017: +7.1 degrees above average (22.5 F)
2018: -5.1 degrees below average (10.3 F)
2019: -4.8 degrees below average (10.6 F)
2020: -1.0 degree below average (14.4 F)
2021: -8.2 degrees below average (7.2 F)
2022: -9.5 degrees below average (5.9 F)
Note
-February 2012 was the 6th warmest February on record
-February 2017 was the 10th warmest February on record
-February 2015 was the 10th coldest February on record
Since 2012 — 8 Februarys were colder than average in Duluth while 3 were warmer than average.
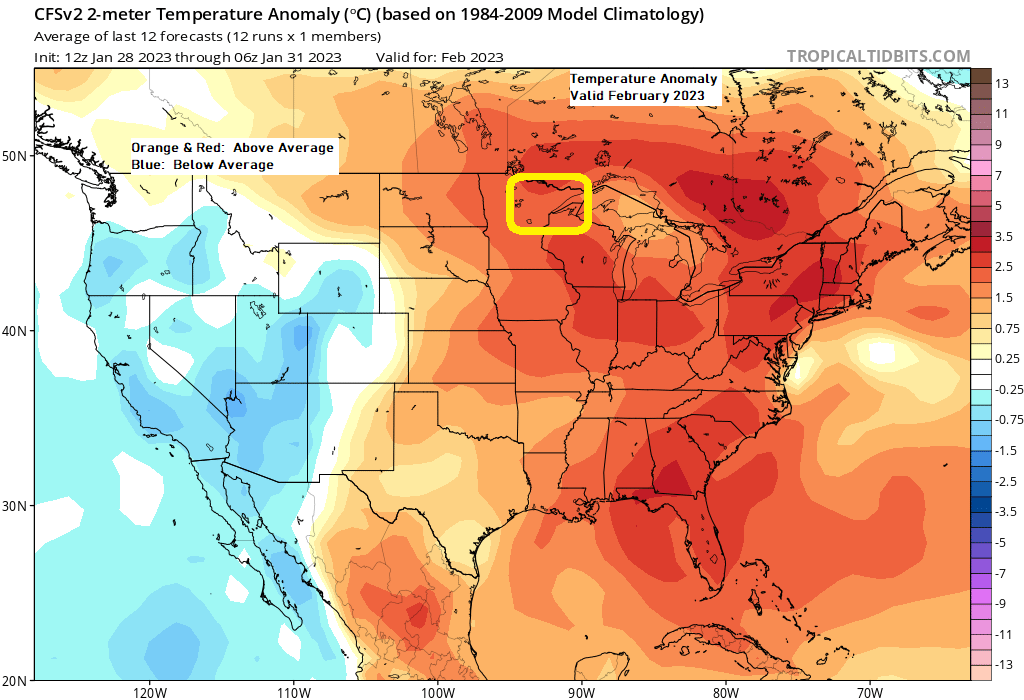
CFS model temperature anomaly trend for February 2023
Orange and Red: Above average temperatures
Blues: Below average temperatures

For Northeast Minnesota and Northwest Wisconsin — CFS model predicts warmer than average temperatures for February 2023.

CFS model precipitation anomaly trend for February 2023
Greens: Above average precipitation
Yellow and Brown: Below average precipitation

For Northeast Minnesota and Northwest Wisconsin — CFS model predicts near normal to slightly above normal precipitation for February 2023.

Note: 27/50 or 54% of Euro ensemble members show warmer than average temperatures in Duluth for February 2023, while 23/50 or 46% show colder than average temperatures.
Highest temperature anomaly per EPS 50-member model: +5.4 degrees above normal
Lowest temperature anomaly per EPS 50-member model: -5.7 degrees below average
The average temperature anomaly of all 50 members is +0.5 degrees warmer than normal.
Thanks for reading!
Tim
Leave a Reply