5:32 PM Friday, December 1, 2023
November 2023 was warmer and drier than average across the Northland.
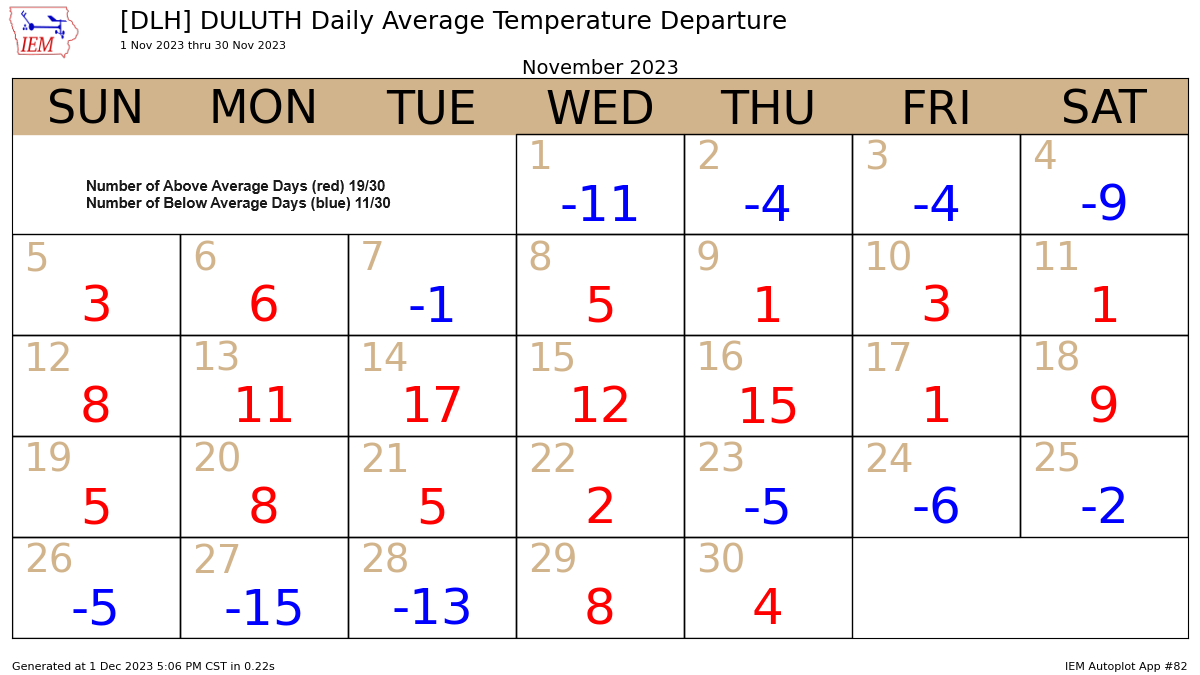
63% of days in November 2023 were warmer than average in Duluth vs. 37% of days which were colder than average.
Note — Snowfall was well below average last month in Duluth with just 1.3″ of snow (-12.8″ below normal) Normal snowfall in November is 14.1″. Duluth received Just 9% of its normal snowfall last month.
Snowfall was also below average at International Falls last month with 4.9″ of snow (-7.2″ below normal) Normal snowfall in November is 12.1″. Percent of normal snowfall was 40% of normal.
Average monthly temperature and departure from normal for November 2023
Ashland, WI: 34.2 degrees, +1.9 degrees above normal
Brainerd, MN: 33.4 degrees, +2.7 degrees above normal
Duluth, MN: 31.6 degrees, +1.8 degrees above normal
International Falls, MN: 28.9 degrees, +2.6 degrees above normal
Hibbing, MN: 27.9 degrees, +2.3 degrees above normal
Here’s a look at the highest and lowest temperatures that were recorded during November 2023
Ashland, WI: 68 on the 16th. 4 on the 28th.
Brainerd, MN: 61 on the 17th and 16th. 1 on the 28th.
Duluth, MN: 58 on the 14th. -2 on the 28th.
Hibbing, MN: 56 on the 14th. -8 on the 28th.
International Falls, MN: 58 on the 14th. -6 on the 28th.
November 2023 Departure from Normal Temperature

Lower 48 Temperature Anomaly for November 2023
Orange and red colors: Warmer than average
Blue colors: Colder than average

November 2023 Average Temperature Ranks by Climate District

Total Precipitation for November 2023
Duluth, MN: 1.32″
International Falls, MN: 1.24″
Hibbing, MN: 0.89″

Percent of Normal Precipitation for November 2023
International Falls, MN: 89% of normal
Hibbing, MN: 82% of normal
Duluth, MN: 67% of normal

Note — A top 10 driest November on record by climate district in the darker brown areas on the map below.
November 2023 Total Precipitation Ranks by Climate District.

Thanks for reading!
Tim
Leave a Reply